Vacuum system pumps and components can deteriorate over time, and recording their performance when they’re functioning well can be a good predictive maintenance tool. We have found a nice way to do just that with a digital vacuum gage that can read pressure over 7 decades of rough and fine vacuum. The unit has two sensors (piezo and Pirani) that provide high resolution and precision. It reads over the range from 900 to 5 x 10⁻⁴ Torr absolute pressure (or 1200 – 5 x 10⁻⁴ mbar (=hPa).
Shown below is a typical plot of pressure versus time which can be obtained as part of regular system maintenance. If the system pump down performance deteriorates from a standard, it’s fairly easy to see it and start corrective action. If you suspect there’s a problem with your pumping system, isolate the pump from the chamber and run a “blank-off test” to evaluate it.
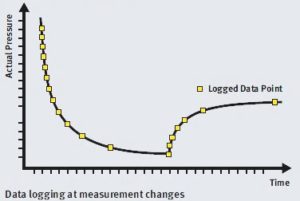
Pump Down (Left Curve). Leak Up (RH Curve).